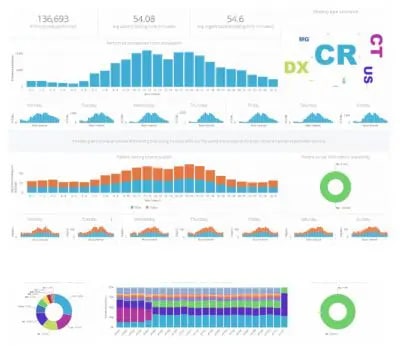
Clear insights for more informed decision-making and supporting the control of your health organization’s finances.
Easy-to-access reports and tools let you gather, organize, analyze and manage your clinical, quality, financial and administrative data. You have what you need to make informed decisions – and then demonstrate how performance has improved!
Make the most of your people and materials.
Get a deeper understanding of how your staff’s time is being spent, and your modalities are being used. Maximize the potential of every resource, plan your staff schedules to meet the department’s real needs, and map out the right storage investments.
“Patients may not directly see how the BI solution is impacting them, nonetheless, they are reaping the benefits: Images that don’t get lost, shorter wait times, faster report turnaround, smoother invoicing and better overall quality of care…”
“Oh yes, it does make a difference for the patient!”
“Oh yes, it does make a difference for the patient!”
Gain real-time insight into your operations
Your KPIs become actionable improvement tools that you can use to benchmark departmental performance, detect productivity gaps, and make better-informed decisions.
Optimize your financial controlling
Enterprise-wide analytics software and statistics help identify the financial impact of operational changes, and find fair ways to allocate costs for shared enterprise IT resources across departments.
Improve your operational efficiency
With seamless access to all your operational data, organized in customizable reports, you have all the insight you need to improve efficiency.
Show your strengths, to attract and retain patients and referrers
Your success depends on the satisfaction of the referring community and your patients. Eliminate bottlenecks to improve the patient’s experience, and reach out to referring physicians with insight for better delivery of patient care. Benchmark your performance to highlight your strengths and support certifications and accreditations.
NEW – Data Visualization Platform
- Massively accelerates the creation of standard reports and thus accelerates release cycles.
- Enables the embedding of reports in desktops because of a usage independent cost model.
- Faster report customization through more user friendly:
- representation of the data catalogue
- user interface to create analysis and reports
- More attractive “look and feel” through a more modern visualization of reports.


